Support / Help Center / Admin Help Center / Interpreting Your Results
Interpreting Your Results

Roar V. Bovim
CEO & Founder @Livingroom
Dashboard
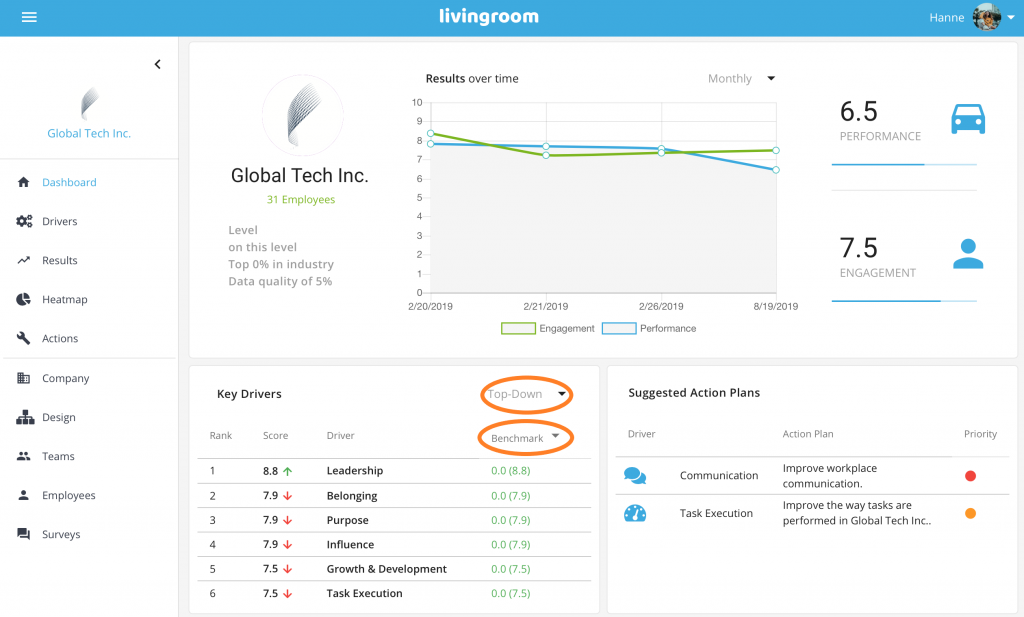
Depending on your view choice, the dashboard shows an overview of your recent survey results for your company or one particular team:
- Employee Performance Score;
- Employee Engagement Score;
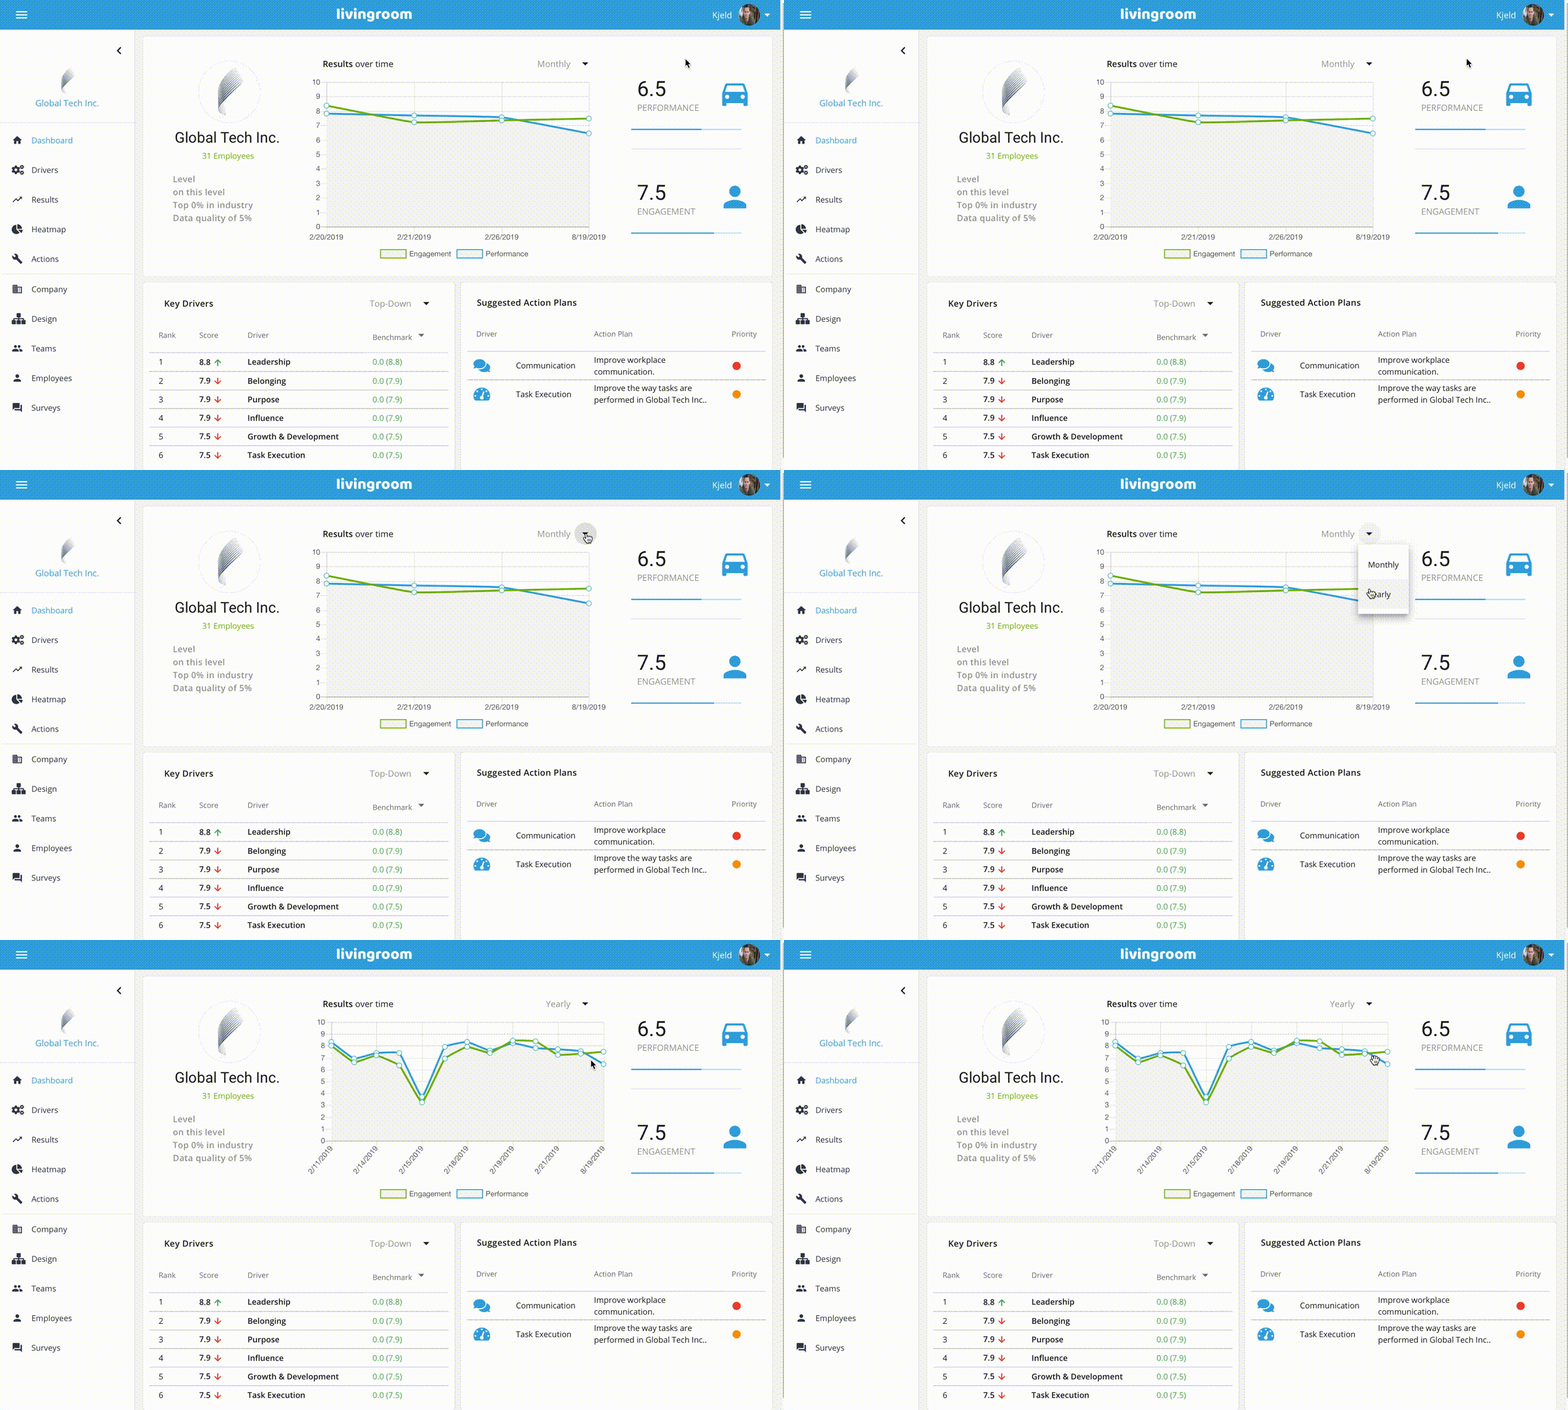
- A graph showing the history of Employee Performance and Employee Engagement over time. Click on the small arrow at the top-right corner of the graph to change views from Monthly to Yearly;

- The bottom-left box shows scores for 6 of the key drivers. Click on the arrow on the top-right corner to change custom view: top-down, bottom-up, top-bottom. The order is based on the rank among the 12 main key drivers. You can view live benchmark with your company or industry by clicking on the benchmark arrow;

- Suggested Action Plans. For the particular survey, you can see the suggested action plans. See our article about the Actions Page for more information.
Drivers
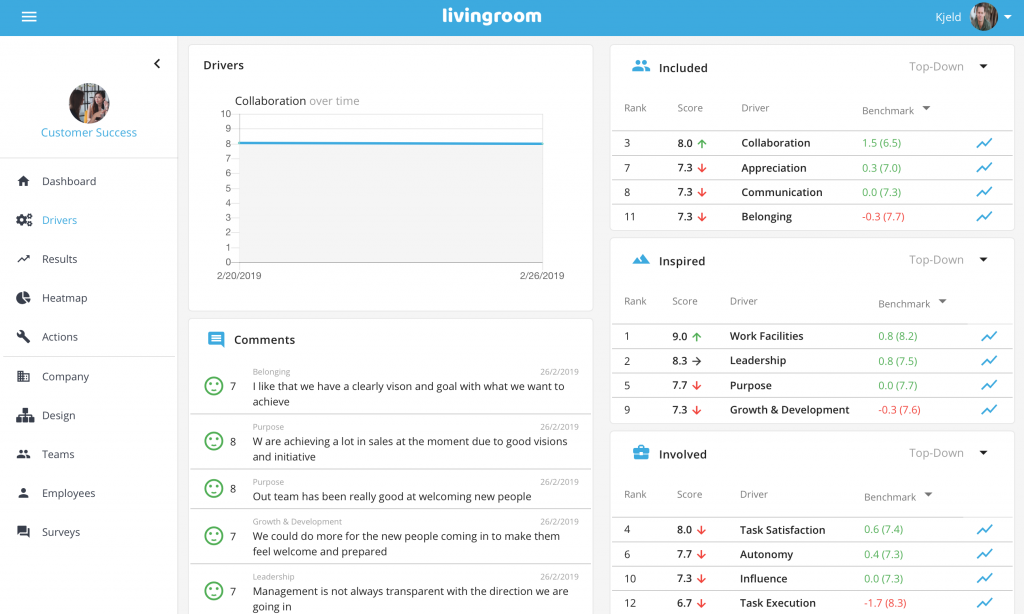
The drivers page shows an overview of the 12 key drivers in Livingroom.
The drivers are divided into Livingroom’s three key areas for building a thriving workplace: Included, Inspired, Involved:
- Included Box: key drivers are Belonging, Appreciation, Communication, and Collaboration;
- Inspired Box: key drivers are Growth & Development, Purpose, Leadership, and Work Facilities;
- Involved Box: key drivers are Task Satisfaction, Task Execution, Influence, and Autonomy.
The row for each of the key drivers contains different information:
- For each driver, Livingroom is showing the driver score. The small arrow next to the score indicates if the score is going up, down, or straight forward since last surveys;
- The left column shows the rank number for each driver, telling how the driver ranks among the 12 key drivers. The drivers that rank highest are the ones that your team or company is doing well at.
- Clicking on the Benchmark Arrow, you can see a live benchmark for the chosen driver.
- Finally, clicking on the curve in the right column of each driver, you will change the display of the top-left graph box and view the driver history for the particular driver.
In addition to the driver list, the Drivers page is also showing a list of the anonymous comments from your employees. On top of each comment, you can see the drivers that were commented on and, next to each comment, you can also see the particular score that was given for this driver. Click on the arrows at the bottom of the comments list to view more comments.

Results
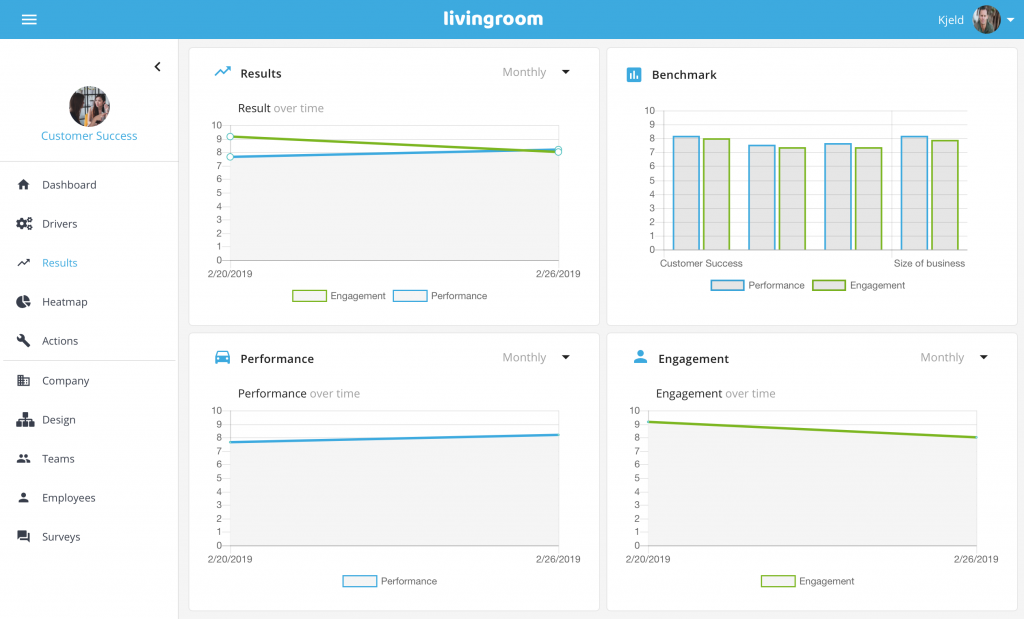
The results page shows an overview of the scores for Employee Engagement and Employee Performance.

